What a Typical Year of Course Sales Looks Like

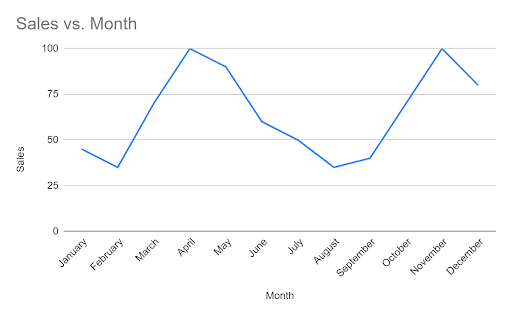
This is what a typical year of course sales looks like. 

I’ve compiled the data based on the following:

  • My clients and other creators
  • Marketplaces and self-hosted courses
  • Evergreen niches 
  • Seasonal niches

To come up with a solid average.

What to do with this data?

  • Use slow months to work on your funnel
  • Use slow months to dial in your advertising (pricing is usually lower)
  • Use high months to schedule launches
  • Use high months to promote deals

Do not fight the cycles. Use them to your advantage.

Whenever you’re ready, there are 2 ways I can help you:
  1. If you’re still looking for traction in your online course, I’d recommend starting with an affordable guide:

The Course Engine: Transform your course into a money-making machine with The Course Engine. This quick and actionable guide will teach you the system I use to transform average courses into ones that can grow past 7 figures in revenue with my in-person clients.  Join 279+ students here.

  1. Want an expert to take over or help you with your marketing?

Check out what we do, our case studies and book a free consultationwemarketonlinecourses.com

ABOUT THE AUTHOR

Join others just like you. Learn more about Tom Libelt and Smart Brand Marketing